Why Overtime in Office Towers may be Unhealthy for You


The graph in this article is one of the most interesting and influential ones I’ve worked with in my career. Although it looks somewhat daunting, it is well worth taking a moment to understand. The insights will surprise you.
Although the original intent of the graph was to explain the impact of plants on indoor air quality, it resulted in highlighting how dramatically indoor air quality conditions within office towers can change over a very short period of time, exposing unsuspecting tenants to hazardous pollutants. This realization then led to completely rethinking the way buildings should be designed.
The graph was the result of a research project conducted in 2016, whereby two identical conference rooms were used to study the impact of plants on indoor air quality. One room was equipped with a green wall while the other was kept as a control room.
Over a 10 week period, three people occupied the rooms, and CO2, Particulate Matter, VOCs, Temperature and Humidity were continuously measured.
Not surprisingly, lower CO2 levels were measured in the plant wall room. Surprisingly, the CO2 graph comparing the performance of each room became the unexpected starlet of the study.
Far more surprising were the results from the graph below. Pay very close attention, the insights are worth the read.
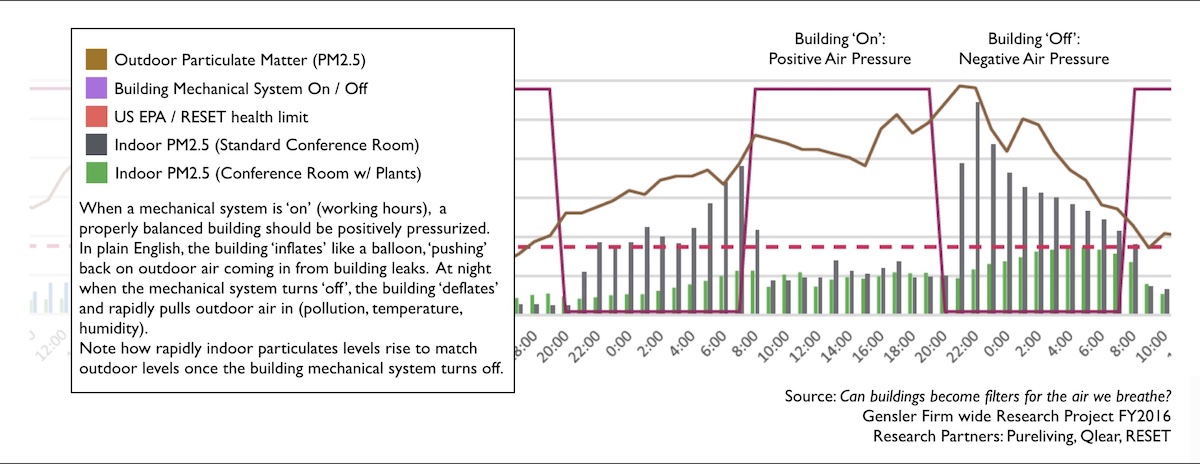
The brown line indicates outdoor pollution levels. In this particular case, particulate matter (PM2.5). Note however, that the results of the study would apply to virtually all outdoor pollutants.
The dotted red line indicates the health threshold for the pollutant being measured (PM2.5).
The purple line indicates the building’s mechanical system being turned on and off.
The vertical green and grey bars indicate PM2.5 levels within the conference rooms.
A building that is properly operated inflates like a balloon when the mechanical system is turned on. In other words, it becomes positively pressurized. This simply means that the inside pressure is greater than outside, resulting in air slowly bleeding out of the building. Positive pressurization allows indoor air filtration and conditioning systems to function effectively by keeping outdoor conditions at bay. Case in point; within both conference rooms being measured, PM2.5 levels are maintained below RESET health limits while the building systems are on.
However, once the central mechanical system is turned off, the building ‘deflates’ and becomes negatively pressurized. The building sucks in outdoor air, inclusive of its pollutants, temperature and humidity.
In this particular study (a Grade A office building), indoor air quality rapidly deteriorated the moment the central mechanical system was turned off. In the conference room without plants, indoor pollution increased and matched outdoor levels in just under two hours. This is shown by the vertical grey bars on the graph.
For those working overtime and thinking their building is protecting them from outdoor conditions, think again.
It is also important to note that it isn’t only indoor particulate levels that change when the mechanical system turns off, but also temperature and humidity. A great deal of energy is also wasted in the process.
This quick and dramatic swing in indoor conditions not only affects occupant comfort and health but also raises a number of critical questions about building design and operations, including energy consumption. But first, let’s focus on the conference room with the green wall.
Incredibly, after the central mechanical system was turned off, PM2.5 levels in the conference room with plants increased very slowly, apparently buffered by the plants. This result, which was consistent over the 10 week test period, contradicted every report we had read about plants and their impact on PM2.5. In theory, plants do not have the ability to filter PM2.5.
Judging by how rapidly dust accumulated on the green wall, in particular on broad-leaf plants, our hypothesis is that healthy leaves act as mini electrostatic precipitators (ESP). Dust particles of various sizes and weight, inclusive of 2.5ug, are attracted by the electrostatic charge produced by the plant and precipitate onto the surface of the leaf. Seeing as the cleaning staff wipe down the leaves daily, these mini-ESP units were able to continually maintain their effectiveness.
Although plants don’t clean dust via filtration, they do seem to have a tremendous effect of doing so by electrostatic precipitation, as long as leaves are cleaned periodically.
Now, back the dramatic shift in indoor conditions at the end of every working day. Presented with these findings, all building owners and operators have asked the same questions:
Should we extend the operational hours of our mechanical systems?
If so, for how long? Our building technically never shuts down: there may be tenants or maintenance staff working at any hour of the night.
Would tenants be willing to pay for the added expenses?
How should we handle the weekends when systems are off but tenants come in to work?
The reality is, there is only one good answer to these questions: completely rethinking the way buildings should be designed and operated, by introducing a ‘State’ system within a building’s central ‘Federal’ mechanical system. This is the subject of my next post: Why Buildings should Run like Countries.
Conducted in 2016, the research project described was led by Kyle Mertensmeyer while running an air quality research project at Gensler. Guidance, sensors and analytical software were provided by Pureliving, RESET and Qlear.